How Can Big Data Be Used in Urban Planning?
The issue of Built Environment on ‘Big Data and the City’ contains some revealing prospects of how these new streams of data that are largely coming from sensors embedded in the environment can help us understand the city better. This data which is much bigger than anything we have ever had hitherto is big in volume because it is streamed in real time often at temporal resolutions measured in seconds, and it is big in variety because it captures all the variations that occur when data is generated about individual places, people and objects at such fine resolution. This data is changing the way we look at the city – it is changing our focus from the medium and the long term to the very short term: to what happens in cities over second, minutes and hours, if not days and weeks rather than over years and decades that have traditionally formed the focus of urban analysis and planning.
The variety of sensors too is providing us with new ways of measuring the form and function of the city. Sensors may be passive and fixed in the environment or on mobile objects, or they may be activated by human use as in the use of smart phones and the whole panoply of related devices that are used continuously now by an increasing majority of us wherever we are at fixed locations or on the move. I sketch these dimensions in my introductory paper ‘Big Data and the City’ (Built Environment, 42, 3, pages 321-337) but what I do not do in any detail is sketch the way this new perspective might change what we plan and the way we might plan the city. The new temporal perspective certainly offers us the opportunity to think about different kinds of activities in the city in terms of their form and function but in our issue, few of us detail the new sets of possibilities that are emerging from these new forms of automation in the built environment. This is not because we are unaware of the way these new forms of data and their consequent use in understanding human and natural processes in cities on a much finer time scale than anything we have done before, but because we have hardly mapped out the prospects for the use of this big data in planning. Changes in data reveal changes in planning and it is very likely that all these trends to new data for new functions will require a different kind of planning from that we have engaged in in the past: a different kind of planning for a different kind of city.
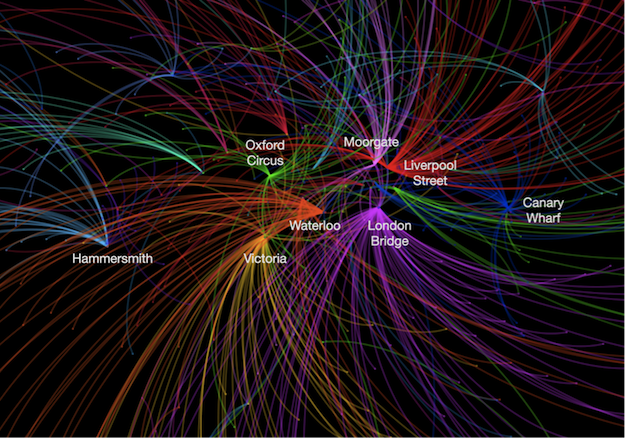
The fact that our papers do not map out how we might use big data in better planning in detail – although in many of them there are some tantalizing glimpses of how we might use such data in our planning (Image 1, below) – provides us with a forum here for speculating on what these prospects might be. Let me throw out some ideas. First the notion that planning is confined to the medium or the long term has always been countered by shorter time scale planning often associated with management and control. For a long time, agencies in cities such as those associated with policing, emergency services, routine administration of taxation and rents, garbage collection and so on have employed systematic approaches to providing best plans for these services. Urban operations research has developed to bring new models of how these services might be improved and this has always required streams of data on short time scales. Big data is forcing a revolution in such service provision, and much of the smart city rhetoric is aimed at improving the delivery of those kinds of services and engaging the population in using the new media to organise and plan such functions better.

Image 1: The Main Digital London Tube Lines Showing the Major Flows
The second notion pertains to a new view of cities which is fast emerging through real time automation. The traditional functions of cities in terms of housing, employment, and transportation are being rapidly augmented by automated processes that are leading to changes on much shorter cycles than hitherto. For example, housing markets are now being organised digitally through the provision of price data, housing finance, and the movement of capital globally. Housing has become an asset class in many cities and this is changing traditional functions. Getting a handle on what is happening requires data in real time and much of this is becoming available – witness the fact that there are now many residential housing web sites that collect and display house prices and sales. People are behaving differently as much because of the availability of this new data as because of any basic change in the structure of their demands. The same is true of transit data (Video 1, below) where much more informed decisions on a routine level are now possible, and this is changing the way we are travelling and what vehicles we might employ for different kinds of travel. Rapid changes in employment are leading to faster job turnover, and automation in the job market is changing the very composition of the work force and the nature of work. All these trends are central to the planning of future cities. Cities without jobs, cities with highly automated transit, cities with autonomous vehicles, cities where the rapid movement of human and finance capital is pricing out entire population groups from residential and job markets – all of the these are consequences of big data and it usage. The repercussions are endless and our debate should embrace these.
In fact, big data is the new oil powering the future economy of cities. What this will mean for our planning is something that we need to debate at length. A new view of what cities are requires new forms of planning and design and I invite readers to speculate on what all this might mean for the future planning of our cities as well as for what our future cities will look like. Big data can reveal more than it seems and this debate extends to the future city, the smart city and to the way we ourselves might be empowered through the new oil.
____________________________________________________________
Images/Videos
Listing Image: Bringing Together Digital Media: A Fly Through of the London Tube (Source: with permission of © Gareth Simons, CASA, https://garethsimons.tumblr.com/)
Image 1: The Main Digital London Tube Lines Showing the Major Flows (Source: with permission of © Ed Manley, CASA)
Video 1: Disabled Freedom Pass Card journeys on the London Underground (Source: with permission of © Gareth Simons, CASA, via Vimeo https://vimeo.com/96998519 )
____________________________________________________________
Join the debate below or with further Built Environment blogs & tweets on this theme!


